
Multichannel WAV
Select, label and compare hydrophone, voltage and directional channels.
Hydrophone data analysis software
Analyze combines multichannel waveform inspection, FFT, responsive spectrogram playback, hydrophone sensitivity data, SPL measurements, event detection and organised exports in one project workspace.
One continuous workflow
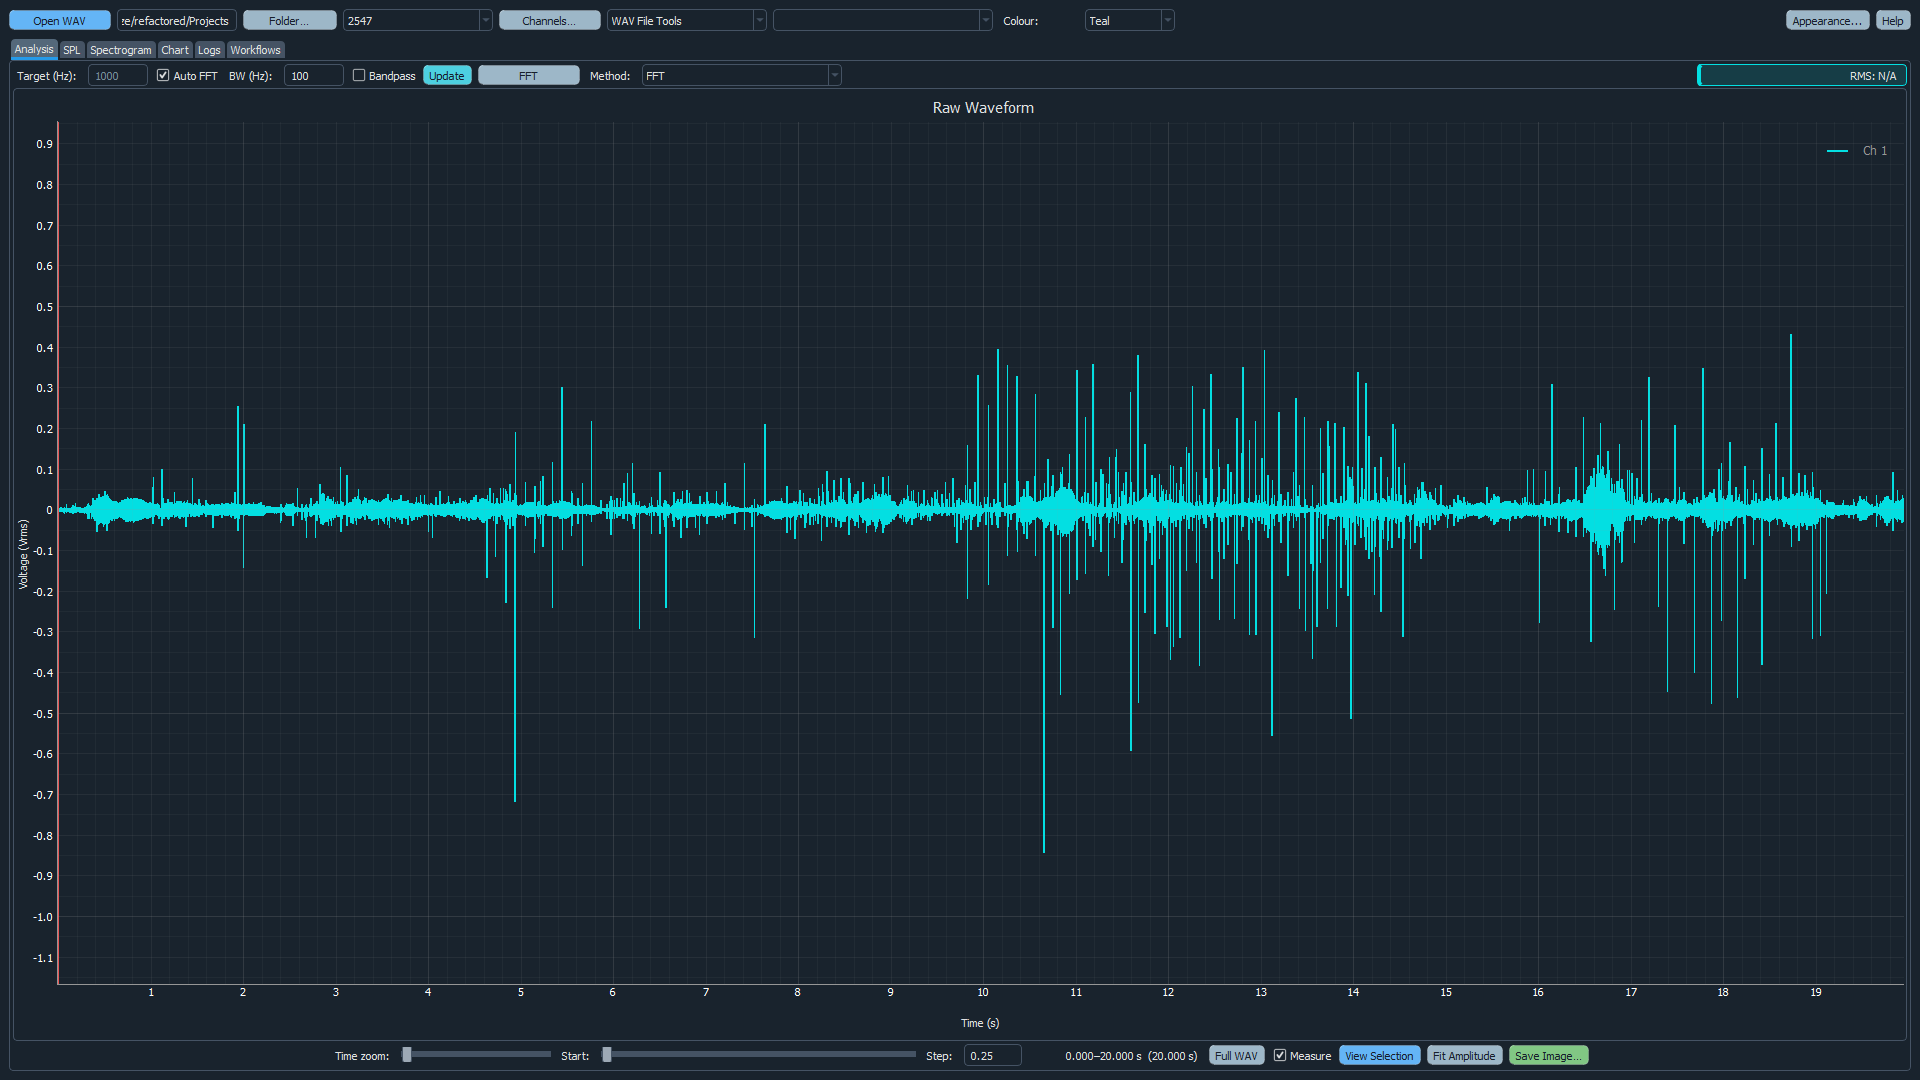
Open uncompressed WAV recordings, choose the active channels and retain channel-specific calibration and metadata as the recording moves through the analysis tools.
Scroll through time, adjust the displayed window, select regions, take measurements and compare channels without losing the relationship to the original recording.
Use FFT and spectrogram views to examine dominant frequencies, tonal components, broadband noise and transient events. Peak labels and saved views preserve the evidence used in review.
Where voltage recordings require calibration, assign hydrophone sensitivity information to the channel and report sound pressure level in dB re 1 µPa. Raw voltage and calibrated results remain distinguishable.
Core capabilities
Select, label and compare hydrophone, voltage and directional channels.
Measure regions, find spectral peaks and export labelled graphs.
Play, scroll, search, select clips and export views or audio-backed video.
Associate sensitivity curves with channels when conversion from voltage is required.
Locate pulses, tonal signals and custom frequency-dependent profiles.
Keep CSV, images, clips, video and model output beneath the selected project.
Common questions
Analyze works with uncompressed WAV recordings, including multichannel files. Calibration and channel roles can be assigned within the project.
Yes. Workflows can use analysed SPL results directly without applying a hydrophone sensitivity curve a second time.
Yes. Project GPS tracks and CTD profiles can supply spatial and environmental context for charting and propagation modelling.
We can demonstrate the workflow using the channel structure and calibration method you actually use.