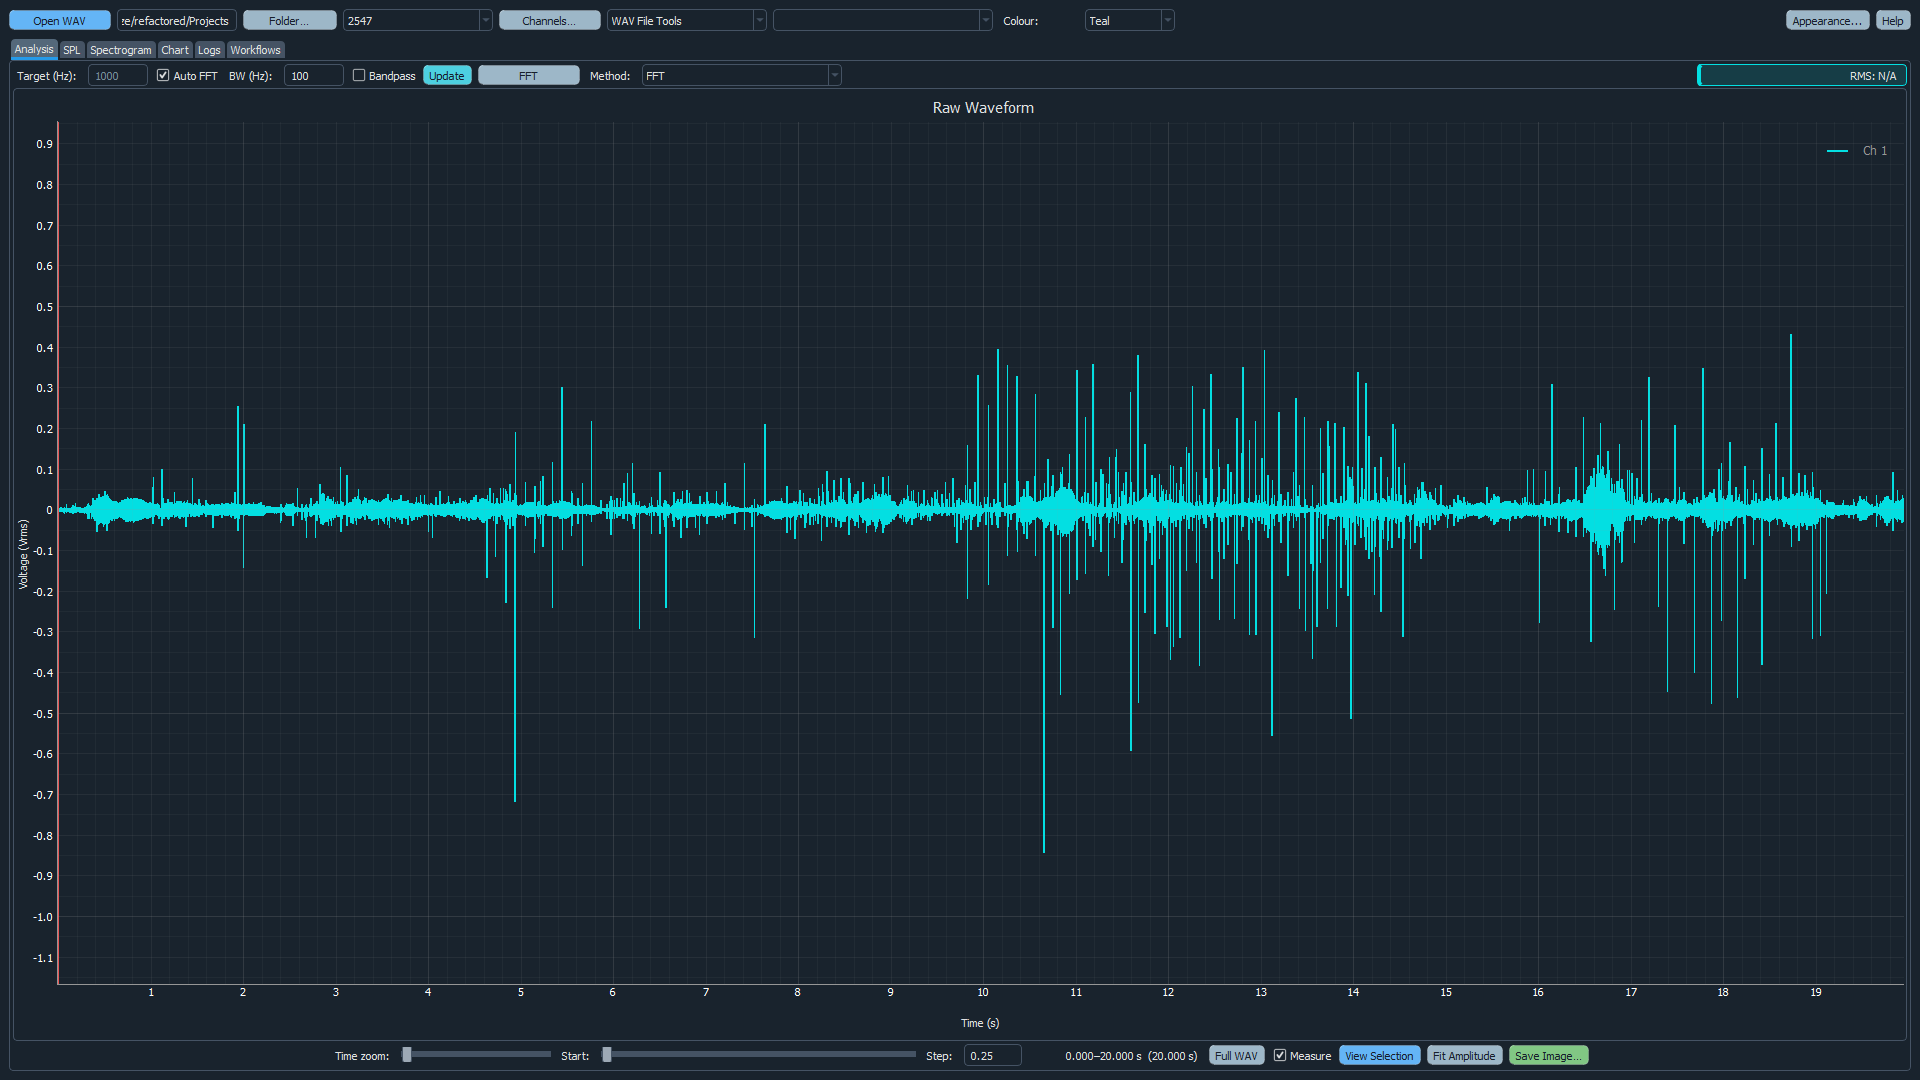
Waveform & FFT
Inspect multi-channel recordings, measure selected regions, find peaks and compare time- and frequency-domain evidence.
Underwater acoustic analysis, in one project workspace
Analyze connects recordings, trainable acoustic classification, calibrated SPL, spectrograms, GPS tracks, CTD profiles and propagation models—so the context stays with the signal from first inspection to final export.
One recording. Its full context.
A connected analysis platform
Work with the same files and metadata across every tool. Channel settings, hydrophone calibration, timing and project outputs remain available as the analysis moves forward.
Inspect multi-channel recordings, measure selected regions, find peaks and compare time- and frequency-domain evidence.
Navigate long recordings fluidly, listen at adjustable speed, search for signals and export selected views, clips or video.
Place acoustic results in time and space using imported tracks, stationary sources, bathymetry and project observations.
Compare bottom types and sea states, apply detection thresholds and align model output with tracks and CTD data.
Review calibrated measurements, explore multi-frequency results and carry selected evidence into consistent tables and plots.
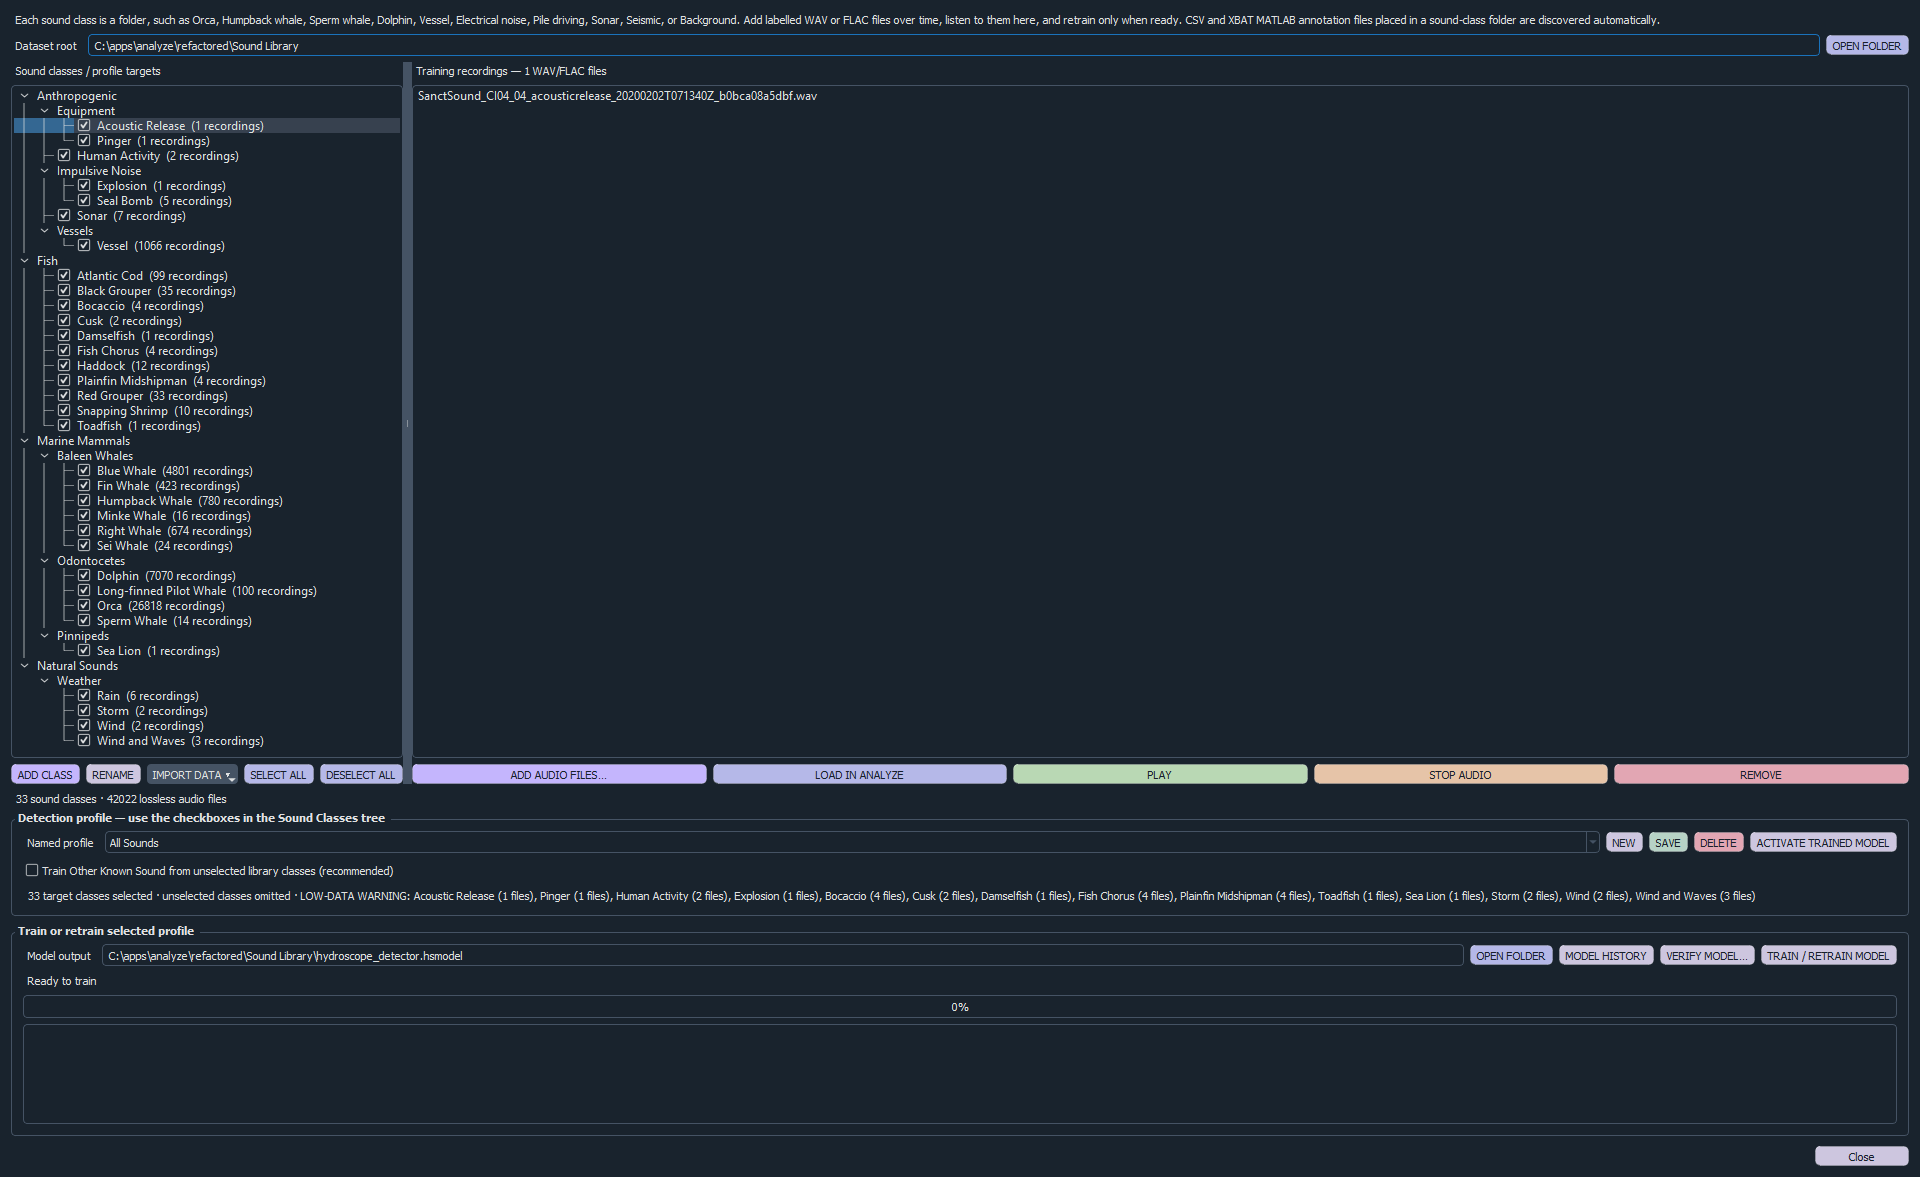
Build labelled sound libraries, train acoustic classifiers and review model-assisted annotations directly against the spectrogram.
Explore by application
Focused guides describe the inputs, methods, evidence and outputs for common hydrophone, directional and environmental workflows.
Multichannel WAV, FFT, spectrogram, calibration and SPL.
02Directional channels, bearing validation and GPS mapping.
03Search, review and track evidence across long deployments.
04Compare receive level, environment, depth, range and position.
05Recorder, hydrophone, directional sensor and CTD families.
06Nova Scotia mapping, DIFAR validation and PAM examples.
07Sound libraries, profile-based training, model verification and reviewed auto-annotation.
08Live Android spectrogram, FFT, calibrated levels, WAV recording, GPS and field-to-Analyze transfer.
09Find candidate events, apply project-trained classifiers and review every proposed annotation.
10Compare biological, environmental and human-made sound with calibrated and project context.
New · Acoustic machine learning
Organise labelled WAV and FLAC recordings into a reusable Sound Library, train complete or focused detection profiles, and apply the active model to candidate events in the spectrogram.
See the work, not a mock-up
Each workspace is designed around the same practical task: understand what happened in the recording, retain the supporting context and make the next action obvious.
Play, search and select acoustic events while the visible time and frequency ranges update in place.
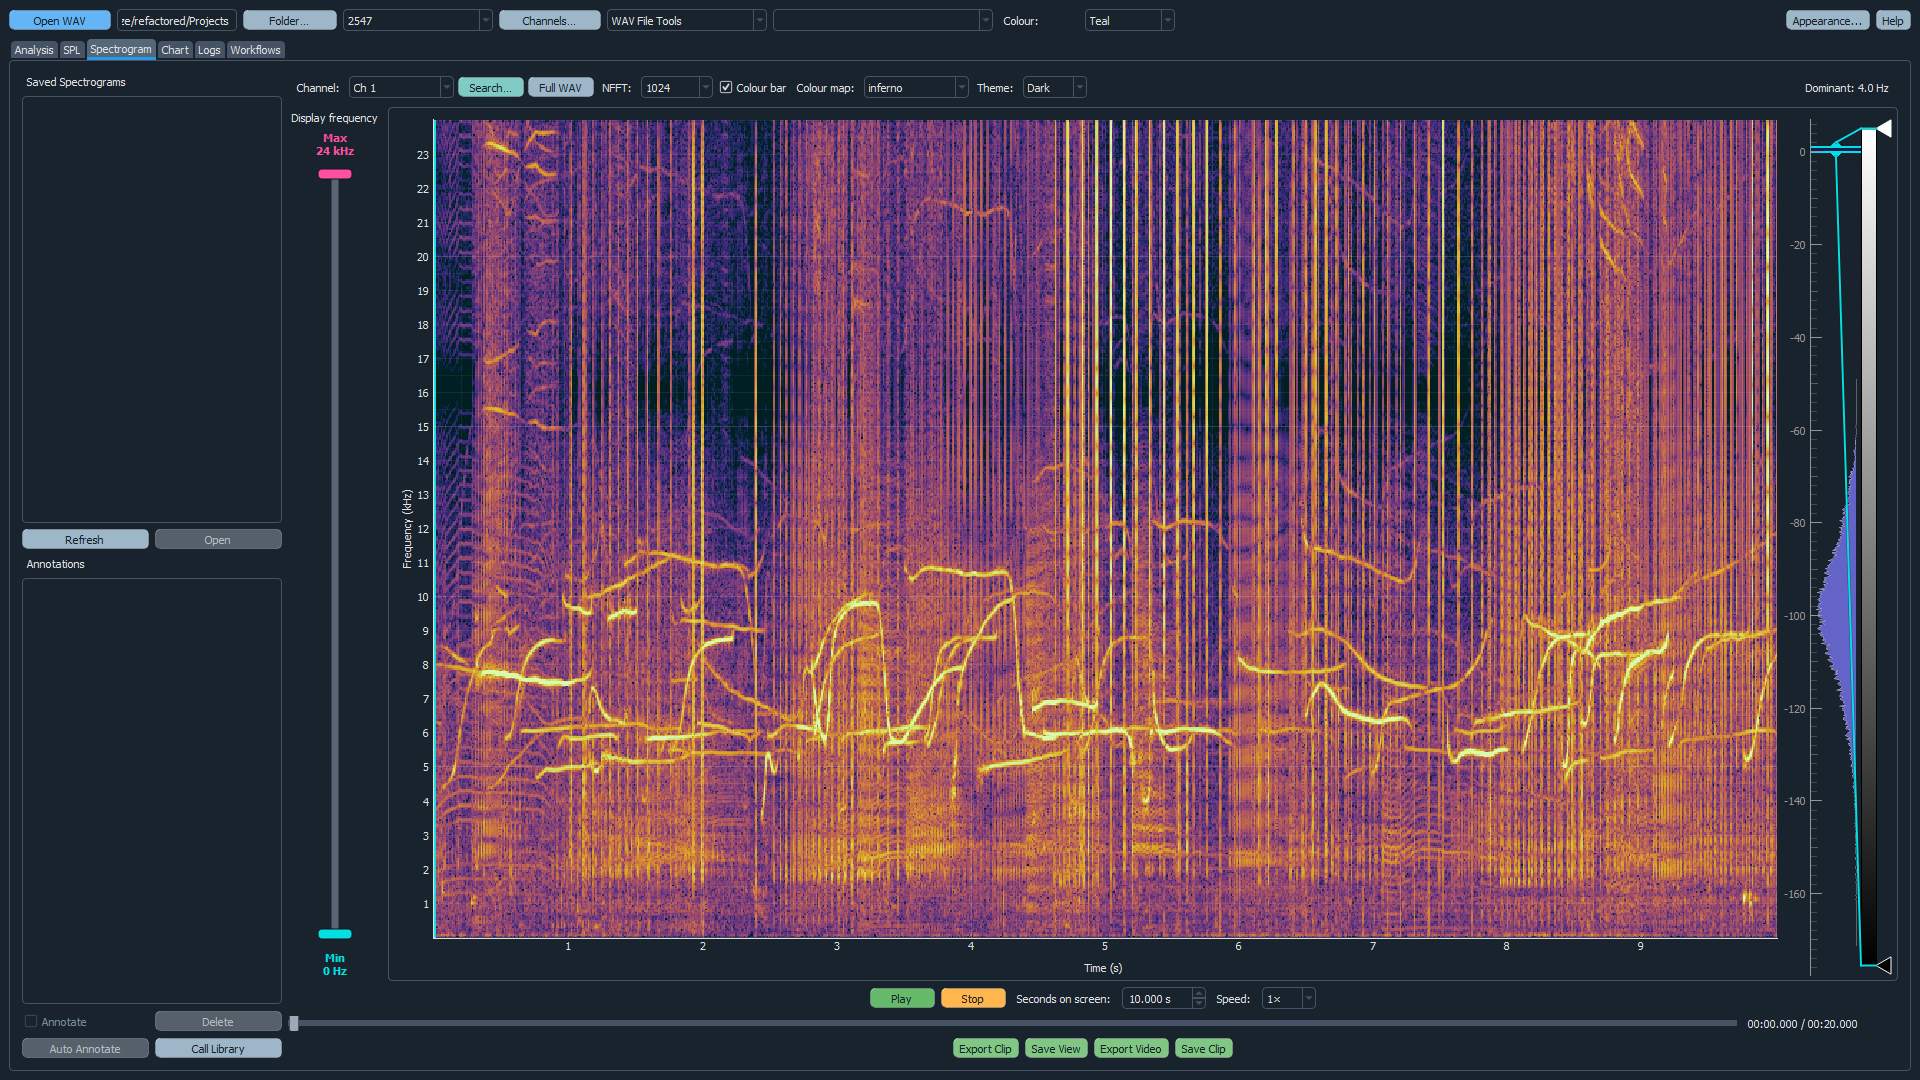
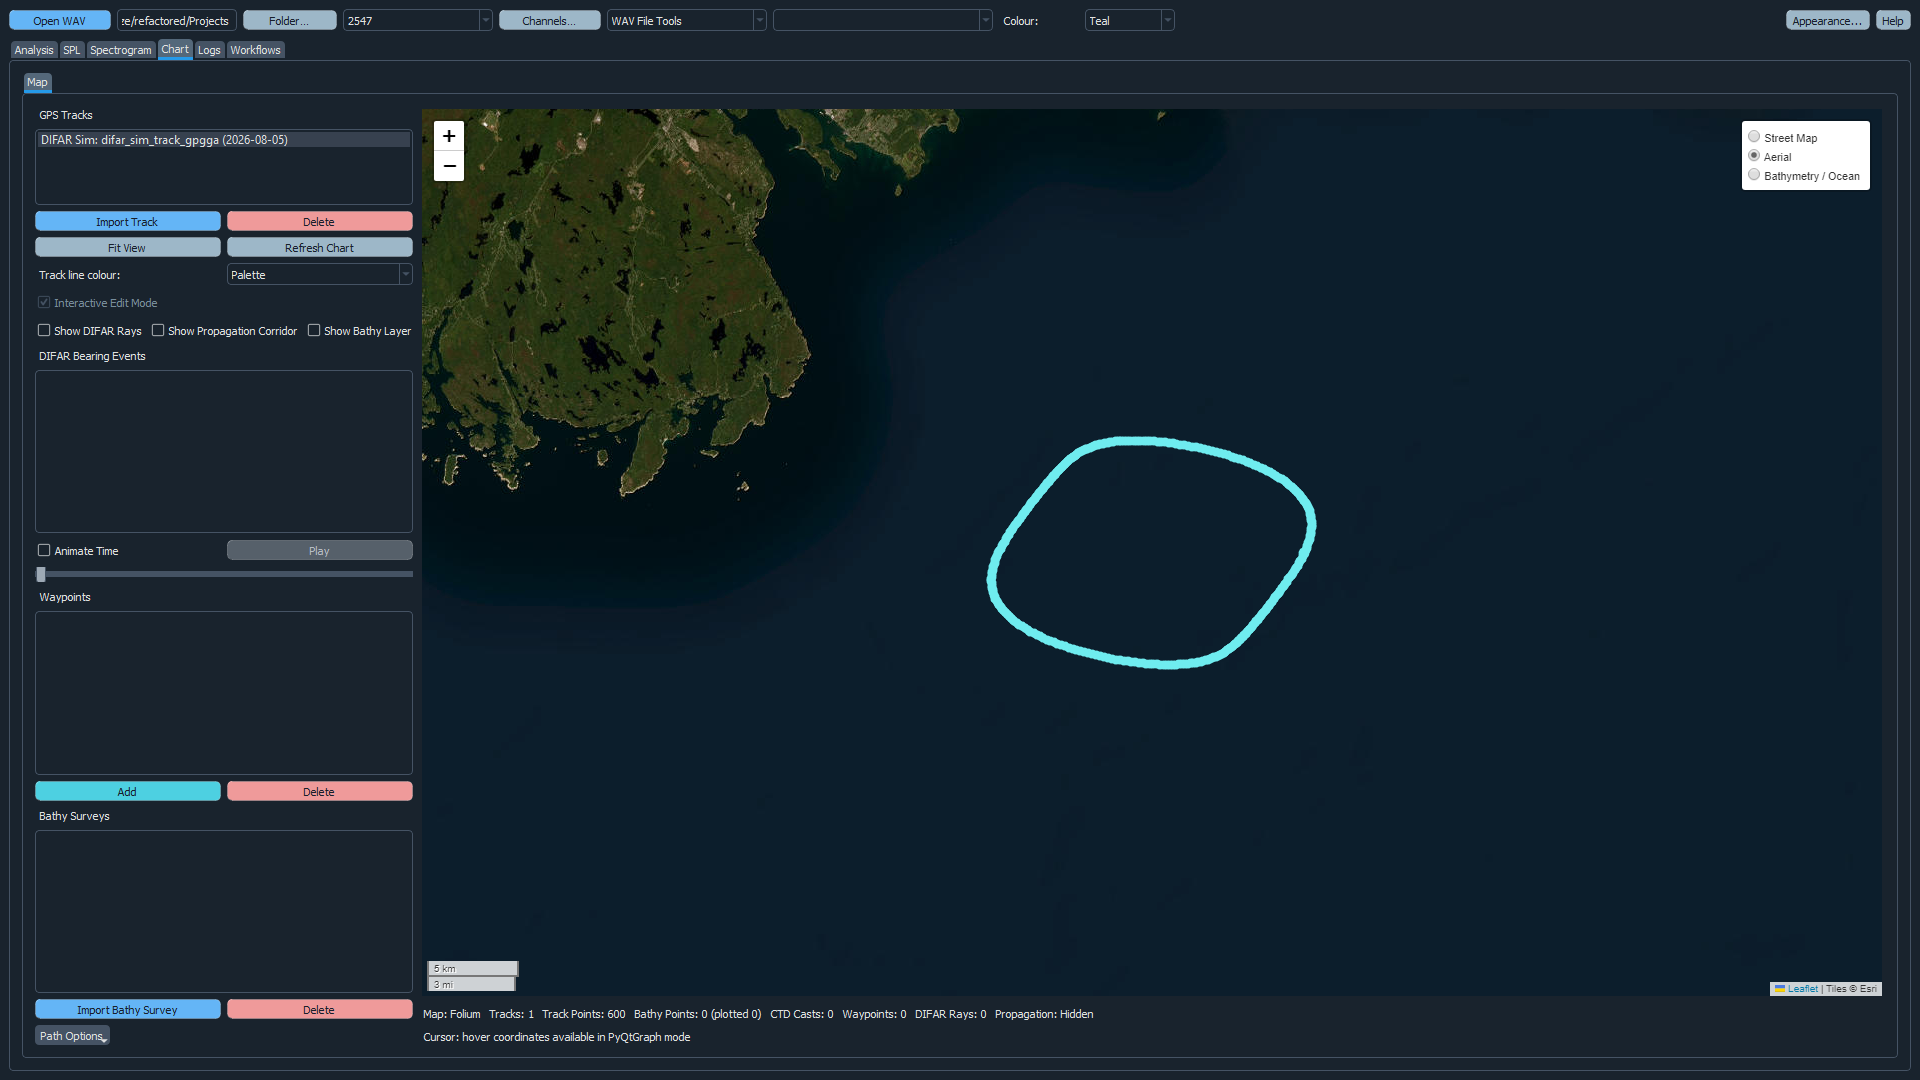
Chart & GPS
The chart workspace places project GPS data on a single, fully rendered Aerial base map. Optional DIFAR, propagation, bathymetry, waypoint and CTD layers can then be added when the analysis calls for them.
Field-to-report workflow
Open recordings, assign channels and calibration, and attach the GPS, CTD or project data that provides context.
Use waveform, FFT, spectrogram and model-assisted annotation to locate events, then review their time-frequency evidence.
Convert voltage measurements where required, compare environmental cases and connect source or receive levels to position.
Check outputs in project tables, retain images and clips, and export organised datasets for reporting or further analysis.
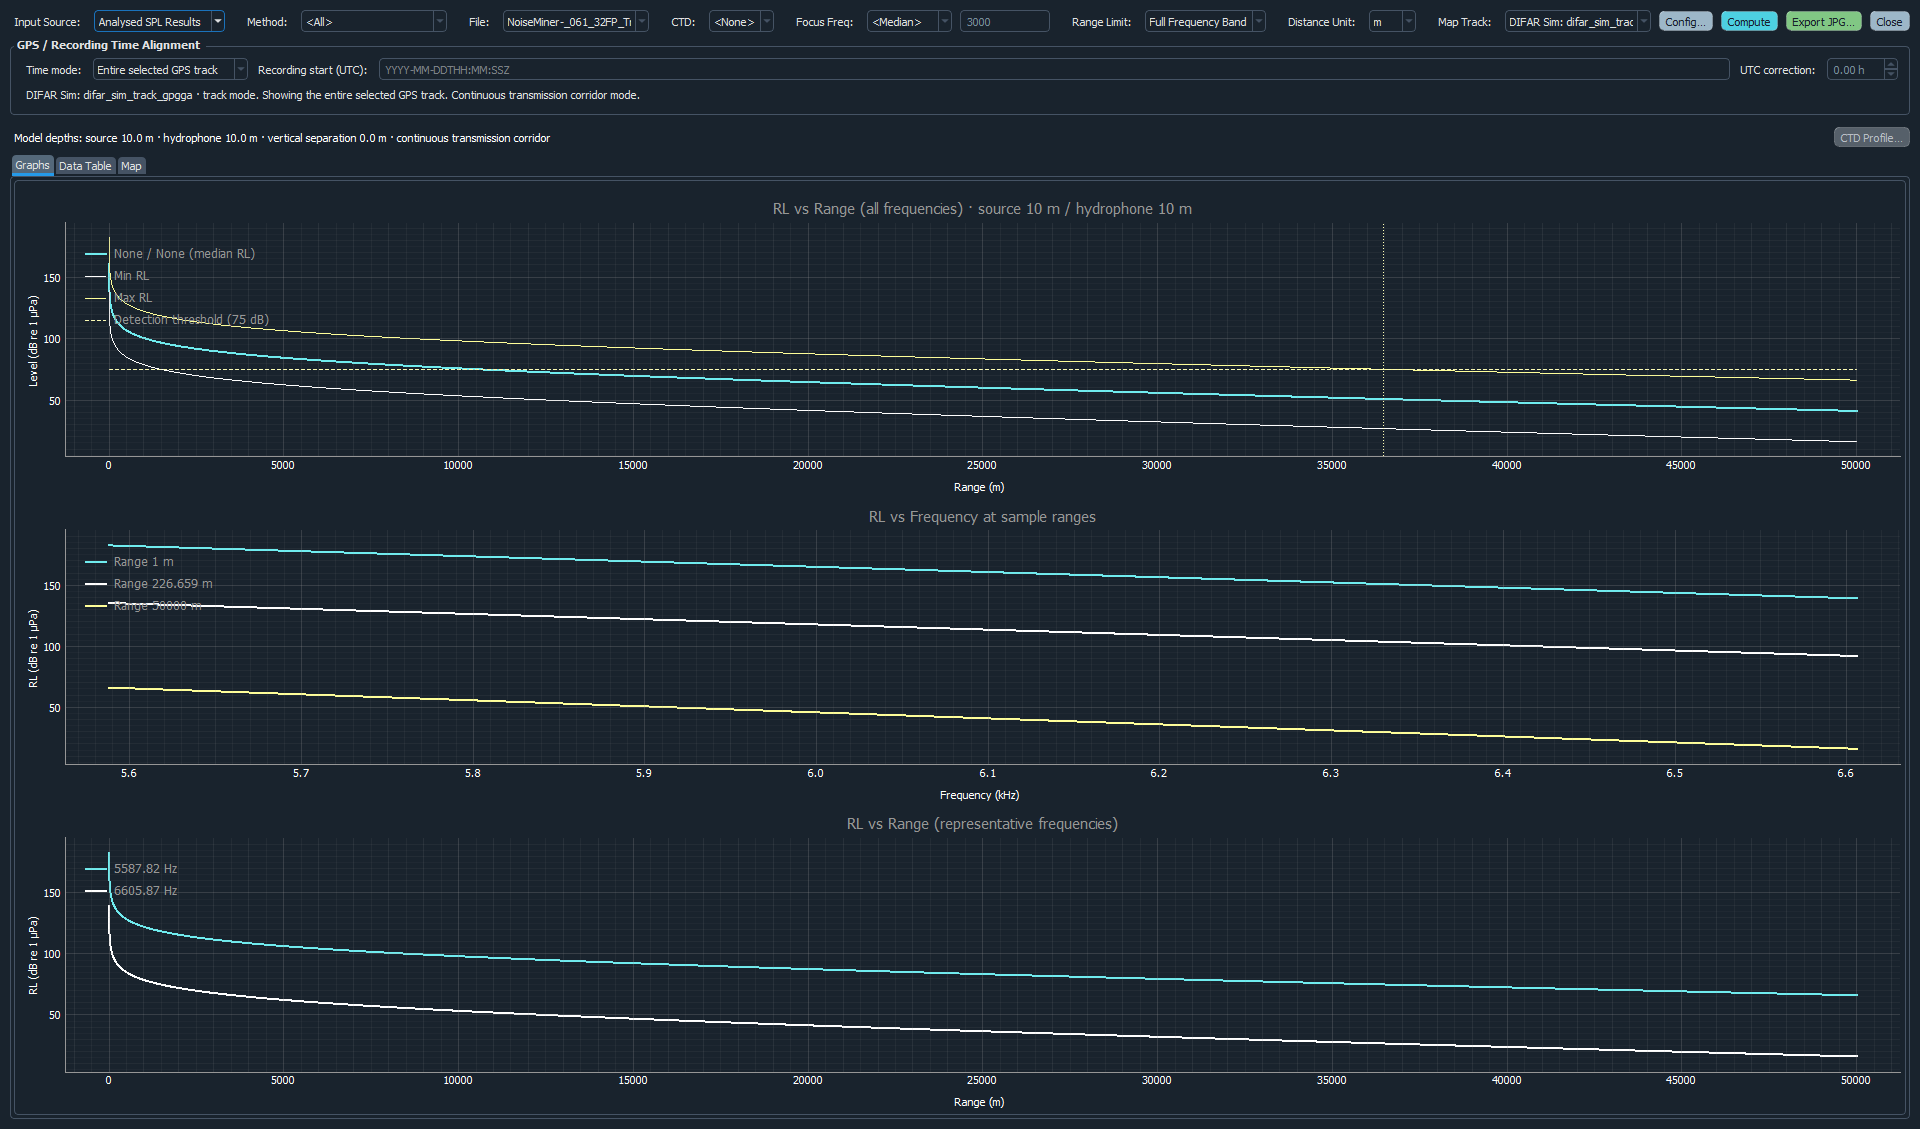
Propagation with operational context
Build comparisons from analysed recordings or entered SPL and frequency values. Then connect the result to the conditions, depths and positions that shaped it.
Outputs that stay organised
Images, clips, video, tables and model exports are saved beneath the selected project instead of disappearing into unrelated locations.
Save the view that supports the finding—from labelled FFT plots and spectrogram video to scenario-separated modelling data.
Use project workflows to track progress across large collections of WAV files and the tests, notes and outputs attached to them.
Data analysis services
Blackfish Acoustics can review hydrophone recordings, PAM deployments, DIFAR data and sonar trials, then deliver documented methods, organised tables and the supporting acoustic evidence.
Explore analysis servicesWaveform, frequency and level analysis using the supplied recording and calibration context.
Candidate-event review, clips, DIFAR bearings and mapped results across project files.
Sonar pulse analysis, GPS and CTD context, environmental comparisons and technical deliverables.
Detailed tool guide
The current Analyze user manual covers project setup, interface controls, analysis tools, modelling workflows and the underlying methods used to interpret results.
Talk to Blackfish Acoustics
Tell us what you are measuring, how the data is collected and where the current process breaks down. We can focus a demonstration around the work that matters to you.
sales@blackfishacoustics.com